

Chart branding assignment (Data Analysis & Visualization MPS Candidate MICA Dec 2023)
data visualization
Newport Folk Festival “Historical Record”

The cover art sets the scene with a crowd shot of Fort Adams - both the record sleeve and record itself deal with venue and crowd size data.The inside cover represents all genres of music performed at the festival over time. As you can see from a glance, the festival started with fewer genres represented and increased dramatically in the 2000s with the hiring of producer Jay Sweet.The back cover features the artists who performed the most at Newport Folk Festival. The tree map groups artists by genre.The record compares crowd size from the first year of the festival to the most recent year, 2022 and features a data sonification element—one track plays crowd size in audience volume.Finally, there’s a pull-out poster. The network diagram shows who has performed together at the festival and separates out each grouping of artists by genre. 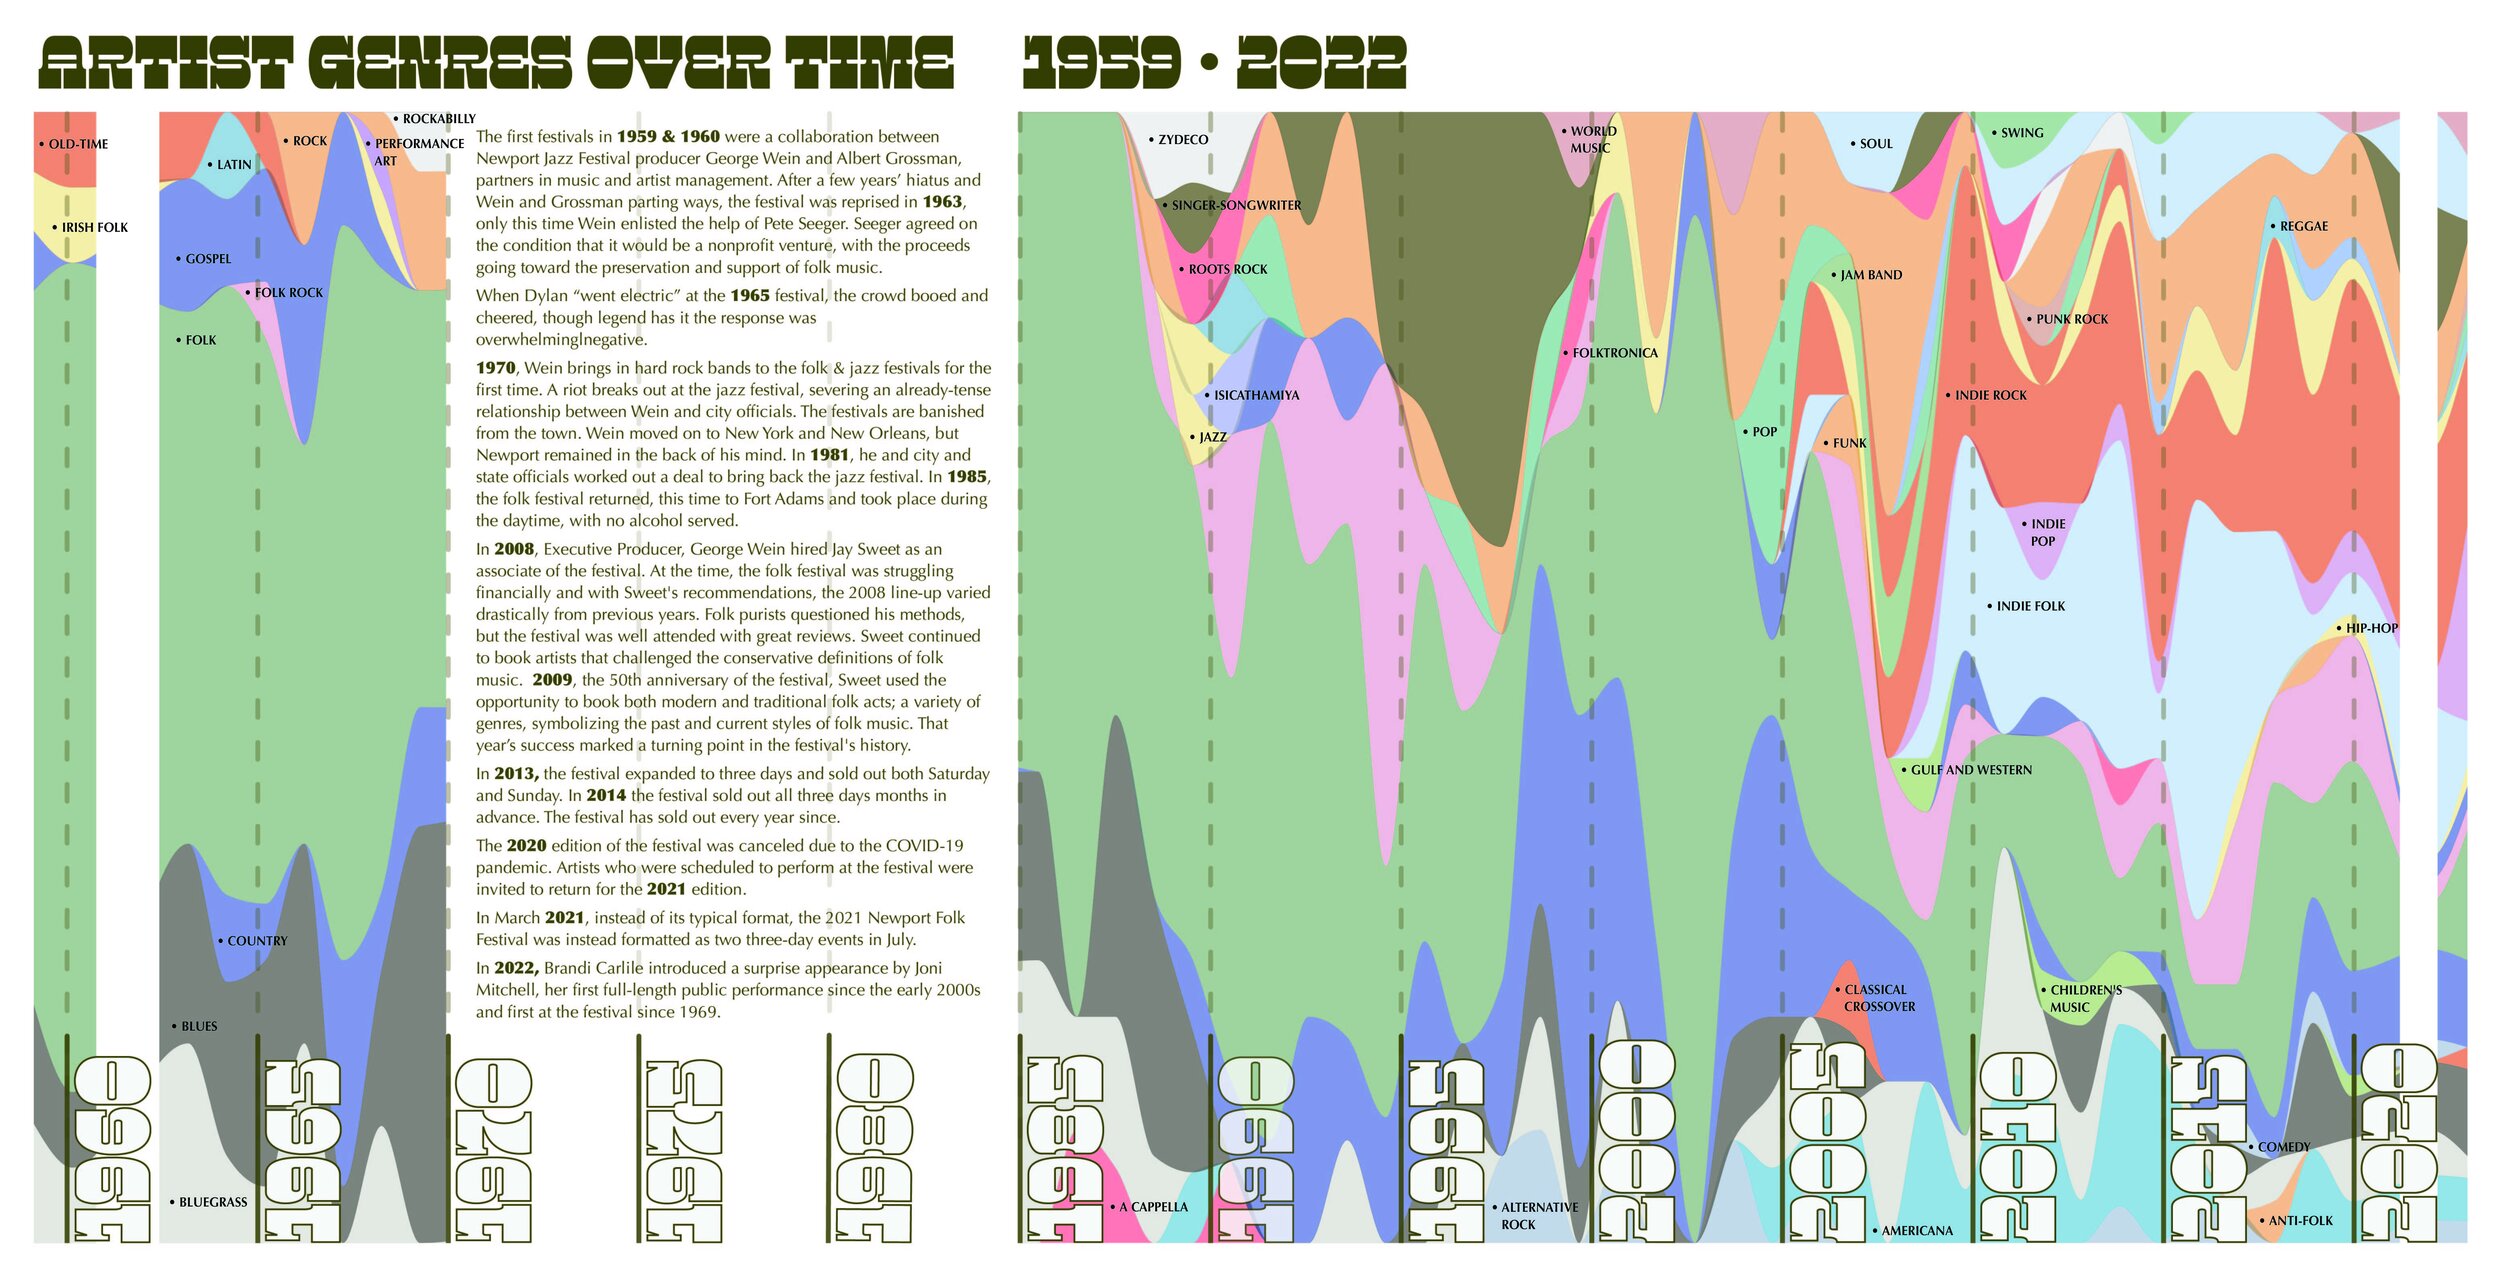
Back cover of record:
heatmap of artists who played Newport Folk Festival the most, grouped by genre.


I created this mock-up historical record for my master’s program in Data Analysis and Visualization at MICA. As you can see in the sketch, many of the elements remain consistent with my original idea. Some chart types change, but overall, the idea worked. 
Record sleeve:
map of first and current venues for the Newport Folk Festival—Freebody Park and now, Fort Adams.


Working with Jordan Brinn, Clean Vehicles & Infrastructure Advocate at NRDC, I created several data visualizations showing the increasing demand on battery supplies in EVs (electric vehicles) and different strategies to reduce demand including, evolving technology, recycling and altering transportation.NRDC Electric Vehicle Battery Supply Chain Report

Exploratory Data Analysis of snowpack, precipitation, and temperature at the U.C. Berkely Central Sierra Snow Lab.


NRDC Electric Vehicle Battery Supply Chain 101 Blog & Issue Brief